
Page 31 - EXPORT HYGIENE & BEAUTY
P. 31
ricerche di mercato
Vendita Volume / Purchase Volume market research
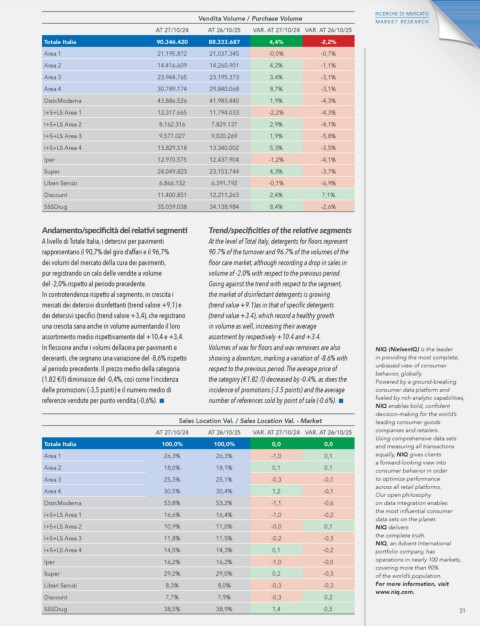
AT 27/10/24 AT 26/10/25 VAR. AT 27/10/24 VAR. AT 26/10/25
Totale Italia 90.346.420 88.333.687 4,4% -2,2%
Area 1 21.195.872 21.037.345 -0,0% -0,7%
Area 2 14.416.609 14.260.901 4,2% -1,1%
Area 3 23.944.765 23.195.373 3,4% -3,1%
Area 4 30.789.174 29.840.068 8,7% -3,1%
Distr.Moderna 43.886.526 41.983.440 1,9% -4,3%
I+S+LS Area 1 12.317.665 11.794.033 -2,2% -4,3%
I+S+LS Area 2 8.162.316 7.829.137 2,9% -4,1%
I+S+LS Area 3 9.577.027 9.020.269 1,9% -5,8%
I+S+LS Area 4 13.829.518 13.340.002 5,3% -3,5%
Iper 12.970.575 12.437.904 -1,2% -4,1%
Super 24.049.823 23.153.744 4,3% -3,7%
Liberi Servizi 6.866.132 6.391.792 -0,1% -6,9%
Discount 11.400.851 12.211.263 2,4% 7,1%
SSSDrug 35.059.038 34.138.984 8,4% -2,6%
Andamento/specificità dei relativi segmenti Trend/specificities of the relative segments
A livello di Totale Italia, i detersivi per pavimenti At the level of Total Italy, detergents for floors represent
rappresentano il 90,7% del giro d’affari e il 96,7% 90.7% of the turnover and 96.7% of the volumes of the
dei volumi del mercato della cura dei pavimenti, floor care market, although recording a drop in sales in
pur registrando un calo delle vendite a volume volume of -2.0% with respect to the previous period.
del -2,0% rispetto al periodo precedente. Going against the trend with respect to the segment,
In controtendenza rispetto al segmento, in crescita i the market of disinfectant detergents is growing
mercati dei detersivi disinfettanti (trend valore +9,1) e (trend value +9.1)as in that of specific detergents
dei detersivi specifici (trend valore +3,4), che registrano (trend value +3.4), which record a healthy growth
una crescita sana anche in volume aumentando il loro in volume as well, increasing their average
assortimento medio rispettivamente del +10,4 e +3,4. assortment by respectively +10.4 and +3.4.
In flessione anche i volumi dellacera per pavimenti e Volumes of wax for floors and wax removers are also NIQ (NielsenIQ) is the leader
deceranti, che segnano una variazione del -8,6% rispetto showing a downturn, marking a variation of -8.6% with in providing the most complete,
al periodo precedente. Il prezzo medio della categoria respect to the previous period. The average price of unbiased view of consumer
behavior, globally.
(1,82 €/l) diminuisce del -0,4%, così come l’incidenza the category (€1.82 /l) decreased by -0.4%, as does the Powered by a ground-breaking
delle promozioni (-3,5 punti) e il numero medio di incidence of promotions (-3.5 points) and the average consumer data platform and
fueled by rich analytic capabilities,
referenze vendute per punto vendita (-0,6%). number of references sold by point of sale (-0.6%).
NIQ enables bold, confident
decision-making for the world’s
Sales Location Val. / Sales Location Val. - Market leading consumer goods
companies and retailers.
AT 27/10/24 AT 26/10/25 VAR. AT 27/10/24 VAR. AT 26/10/25
Using comprehensive data sets
Totale Italia 100,0% 100,0% 0,0 0,0 and measuring all transactions
Area 1 26,3% 26,3% -1,0 0,1 equally, NIQ gives clients
a forward-looking view into
Area 2 18,0% 18,1% 0,1 0,1
consumer behavior in order
Area 3 25,3% 25,1% -0,3 -0,1 to optimize performance
across all retail platforms.
Area 4 30,5% 30,4% 1,2 -0,1
Our open philosophy
Distr.Moderna 53,8% 53,2% -1,1 -0,6 on data integration enables
the most influential consumer
I+S+LS Area 1 16,6% 16,4% -1,0 -0,2
data sets on the planet.
I+S+LS Area 2 10,9% 11,0% -0,0 0,1 NIQ delivers
the complete truth.
I+S+LS Area 3 11,8% 11,5% -0,2 -0,3
NIQ, an Advent International
I+S+LS Area 4 14,5% 14,3% 0,1 -0,2 portfolio company, has
Iper 16,2% 16,2% -1,0 -0,0 operations in nearly 100 markets,
covering more than 90%
Super 29,2% 29,0% 0,2 -0,3 of the world’s population.
Liberi Servizi 8,3% 8,0% -0,3 -0,3 For more information, visit
www.niq.com.
Discount 7,7% 7,9% -0,3 0,2
SSSDrug 38,5% 38,9% 1,4 0,5 31