
Page 8 - EXPORT HYGIENE & BEAUTY
P. 8
ricerche di mercato
ricerche di merca to
market research
m a r k e t r e s e a r c h
SPECIAL NIQ SPECIALE NIQ
The BATH AND
SHOWER FOAMS
market Il mercato BAGNO
DOCCIA SCHIUMA
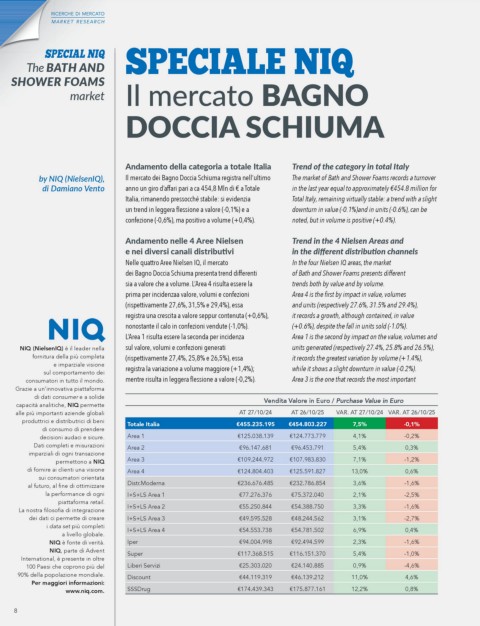
Andamento della categoria a totale Italia Trend of the category in total Italy
by NIQ (NielsenIQ), Il mercato dei Bagno Doccia Schiuma registra nell’ultimo The market of Bath and Shower Foams records a turnover
di Damiano Vento anno un giro d’affari pari a ca 454,8 Mln di € a Totale in the last year equal to approximately €454.8 million for
Italia, rimanendo pressocché stabile: si evidenzia Total Italy, remaining virtually stable: a trend with a slight
un trend in leggera flessione a valore (-0,1%) e a downturn in value (-0.1%)and in units (-0.6%), can be
confezione (-0,6%), ma positivo a volume (+0,4%). noted, but in volume is positive (+0.4%).
Andamento nelle 4 Aree Nielsen Trend in the 4 Nielsen Areas and
e nei diversi canali distributivi in the different distribution channels
Nelle quattro Aree Nielsen IQ, il mercato In the four Nielsen IQ areas, the market
dei Bagno Doccia Schiuma presenta trend differenti of Bath and Shower Foams presents different
sia a valore che a volume. L’Area 4 risulta essere la trends both by value and by volume.
prima per incidenzaa valore, volumi e confezioni Area 4 is the first by impact in value, volumes
(rispettivamente 27,6%, 31,5% e 29,4%), essa and units (respectively 27.6%, 31.5% and 29.4%),
registra una crescita a valore seppur contenuta (+0,6%), it records a growth, although contained, in value
nonostante il calo in confezioni vendute (-1,0%). (+0.6%), despite the fall in units sold (-1.0%).
L’Area 1 risulta essere la seconda per incidenza Area 1 is the second by impact on the value, volumes and
NIQ (NielsenIQ) è il leader nella sul valore, volumi e confezioni generati units generated (respectively 27.4%, 25.8% and 26.5%),
fornitura della più completa (rispettivamente 27,4%, 25,8% e 26,5%), essa it records the greatest variation by volume (+1.4%),
e imparziale visione while it shows a slight downturn in value (-0.2%).
sul comportamento dei registra la variazione a volume maggiore (+1,4%);
consumatori in tutto il mondo. mentre risulta in leggera flessione a valore (-0,2%). Area 3 is the one that records the most important
Grazie a un’innovativa piattaforma
di dati consumer e a solide Vendita Valore in Euro / Purchase Value in Euro
capacità analitiche, NIQ permette
alle più importanti aziende globali AT 27/10/24 AT 26/10/25 VAR. AT 27/10/24 VAR. AT 26/10/25
produttrici e distributrici di beni Totale Italia €455.235.195 €454.803.227 7,5% -0,1%
di consumo di prendere
decisioni audaci e sicure. Area 1 €125.038.139 €124.773.779 4,1% -0,2%
Dati completi e misurazioni Area 2 €96.147.681 €96.453.791 5,4% 0,3%
imparziali di ogni transazione
permettono a NIQ Area 3 €109.244.972 €107.983.830 7,1% -1,2%
di fornire ai clienti una visione Area 4 €124.804.403 €125.591.827 13,0% 0,6%
sui consumatori orientata
al futuro, al fine di ottimizzare Distr.Moderna €236.676.485 €232.786.854 3,6% -1,6%
la performance di ogni I+S+LS Area 1 €77.276.376 €75.372.040 2,1% -2,5%
piattaforma retail.
La nostra filosofia di integrazione I+S+LS Area 2 €55.250.844 €54.388.750 3,3% -1,6%
dei dati ci permette di creare I+S+LS Area 3 €49.595.528 €48.244.562 3,1% -2,7%
i data set più completi
a livello globale. I+S+LS Area 4 €54.553.738 €54.781.502 6,9% 0,4%
NIQ è fonte di verità. Iper €94.004.998 €92.494.599 2,3% -1,6%
NIQ, parte di Advent Super €117.368.515 €116.151.370 5,4% -1,0%
International, è presente in oltre
100 Paesi che coprono più del Liberi Servizi €25.303.020 €24.140.885 0,9% -4,6%
90% della popolazione mondiale. Discount €44.119.319 €46.139.212 11,0% 4,6%
Per maggiori informazioni:
SSSDrug €174.439.343 €175.877.161 12,2% 0,8%
www.niq.com.
8 8